Transportation Trend - July 2023
Latest Update in Transportation Trends
Our monthly update is coming earlier to give shippers an update before the July Fourth Week. Learn about what’s moving in the freight industry including LTL Carrier analysis, upcoming events, and an update to Union Labor talks.
CVSA Operations Safe Driver Week
July 9th to 15th was announced as the annual initiative by the Commercial Vehicle Safety Alliance (CVSA) to enhance road safety and combat dangerous driving practices. During this week, law enforcement agencies through out North America to intensify their efforts to enforce traffic safety laws for Commercial and Passenger vehicle drivers.
As with International Road Check week performed back in May, this CVSA event may affect shippers with delays from trucking drivers. Learn more about the event here
Yellow Corporation Labor Negotiations
Yellow Corporation (national LTL carrier including YRC Freight, Reddaway, Holland, and more) and Teamsters Labor Union have been in headlines recently. Most recent developments include Yellow filing a lawsuit against the Teamsters Union for “being pushed to the brink” because of the Union’s refusal to negotiate with the consolidation effort overhaul from the carrier.
Teamsters Union advised that Yellow Corporation will be “out of money by August”. The union alleges that “Yellow Corporation has been unable to effectively manage itself for a long time… and Teamsters have already given back everything they possibly could to keep Yellow a float.”
In recent months, the Teamsters recently reached a tentative deal with ArcBest (Parent of ABF Freight) and currently working with UPS for labor negotiations. Yellow Corporation is a major player in the LTL environment and it’s important to keep up to date with this issue.
Explanation: Pricing Difference in LTL vs TL
Since the 1Q of 2023, rates for truckload shipments have dropped significantly. However, shippers have not seen the same across Less-than-Truckload Shipments. Why does it feel like truckload shipments plummeted, but LTL rates are going sideways?
Less-than-Truckload (LTL) carriers are much different than truckload (TL) carriers. For starters, LTL carriers’ top 10 carriers make up 95% of market share, while truckload carriers are quite the opposite of the top 10 TL carriers making up less 10% of market share. It requires capital and assets to join the LTL network, which makes the industry a lot less volatile than the truckload market. Truckload carriers must follow market trends to gain business while LTL carriers, collectively, may find other ways to gain market share then dropping rates.
General Rate Increases (GRI) are continuing at 4-6% for LTL carriers this year. The reason is that carriers are looking to find market share in lowering operating costs rather than in lowering rates. Payroll costs continue to be a factor as growth for dockworkers and truck drivers increased. One national carrier TLI works with explained that driver wages are forcing the company to invest in supplying dock workers with CDL training to help alleviate driver shortages.
According to Cleveland Research Company (CRC) , "Our work indicates LTL pricing is rising Y/Y as demand outstrips capacity. We expect LTL pricing likely +4-6% in 2023, despite instances of spot market/3PL market discounting, as carriers opt to reduce capacity (labor, etc.) rather than lower price to win volume."
LTL Rates continue sideways because of LTL carriers focus on market share growth. Instead of lowering rates for market share, they are looking on how to lower operating costs to achieve profitability and market share.
Economy Update
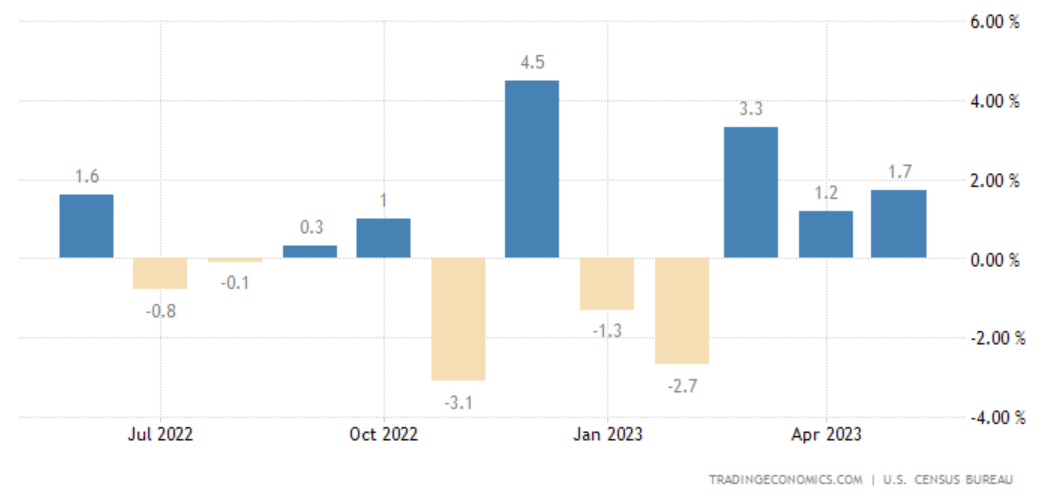
New orders for US manufactured durable goods jumped 1.7% month-over-month in May 2023, following an upwardly revised 1.2% rise in April and easily beating market expectations of a 1% decline. It marks a third straight month of rising durable goods orders, led by a 3.9% surge in transportation equipment, namely nondefense aircraft and parts (32.5%) and motor vehicles (2.2%). Excluding transportation, new orders increased 0.6%. Demand also increased for capital goods (2.8%), namely nondefense ones (6.7%), machinery (1%), computers and electronics (0.3%), electrical equipment (1.7%) and primary metals (0.5%).
On the other hand, orders declined for for defense aircraft and parts (-35.4%) and defense capital goods (-14.7%) and was flat for fabricated metal products. Excluding defense, new orders rose 3%. Meanwhile, orders for non-defense capital goods excluding aircraft, a proxy for business spending plans, increased 0.7%, after a downwardly revised 0.6% rise in April. source: U.S. Census Bureau
United States Durable Good Orders
Truckload Market
National van load-to-truck ratio continued under 3 loads per truck through out June. This is almost 3x lower than this time in 2021 – showing capacity has been very loose for 2023. Spot Rates continue sideways as the market is showing lower rates this year. National Spot rates held at an average of $2.07 per mile while contracted rates continue higher at $2.59 national average per mile. Refrigerated and flatbed equipment rates continued along this trend as well.
Less-than-Truckload (LTL) Update
LTL Carriers recently performance have been less than industry standard. Much like 2021, we are starting to see trends of lower on-time performance from some carriers. In June, TLI had an on-time pickup percentage of 88.24 and on-time delivery percentage of 77.12 percent across the board. The overall TLI goal is 98% On-Time Pickup Percentage and 95% On-Time Delivery percentage.
Look at latest TLI performance indicators for some TLI carriers:
| Carrier | On-Time Pickup | On-Time Delivery |
|---|---|---|
| A Duie Pyle* | 94.76% | 94.76% |
| ABF Freight | 82.15% | 46.05% |
| Dayton Freight* | 94.22% | 96.91% |
| FedEx National | 99.15% | 77.68% |
| FedEx Regional | 98.78% | 82.58% |
| Old Dominion | 72.31% | 84.69% |
| New Penn* | 95.69% | 74.62% |
| Pitt Ohio* | 96.52% | 80.29% |
| R&L Carriers | 93.68% | 84.35% |
| TForce | 84.08% | 62.08% |
| XPO Logistics | 89.01 | 68.50% |
| YRC Freight | 89.85% | 39.11% |
*= indicates a Regional-Based Carrier
Per TLI metrics, regional-based carriers have been out-performing national carriers at on-time percentages. Historically, this is not uncommon to see as national carriers have much longer lengths and higher volumes to handle.
During our conversations with carriers, one national carrier stated that an issue with performance is that 50% of their employees have been at the company for one year or less. With the need of labor on the rise, the carrier stated performance may drop while the carrier trains newer employees up to standard levels.
The Colorado region has also been flagged as a poor performer. A national carrier stated that regulations for the carrier along with state laws have generated a challenge in keeping drivers and dock workers at this state’s local terminal. Colorado can be an important hub for moving freight nation-wide and delays at these terminals can affect national performance.
TLI Insights
Get the latest logistics insights and tips from TLI's award-winning team. Stay ahead in transportation planning.
Questions? Email us at marketing@shiptli.com
Social Media:
Check out more Blog Posts from TLI: